Search Engine Market Share

INSIGHT
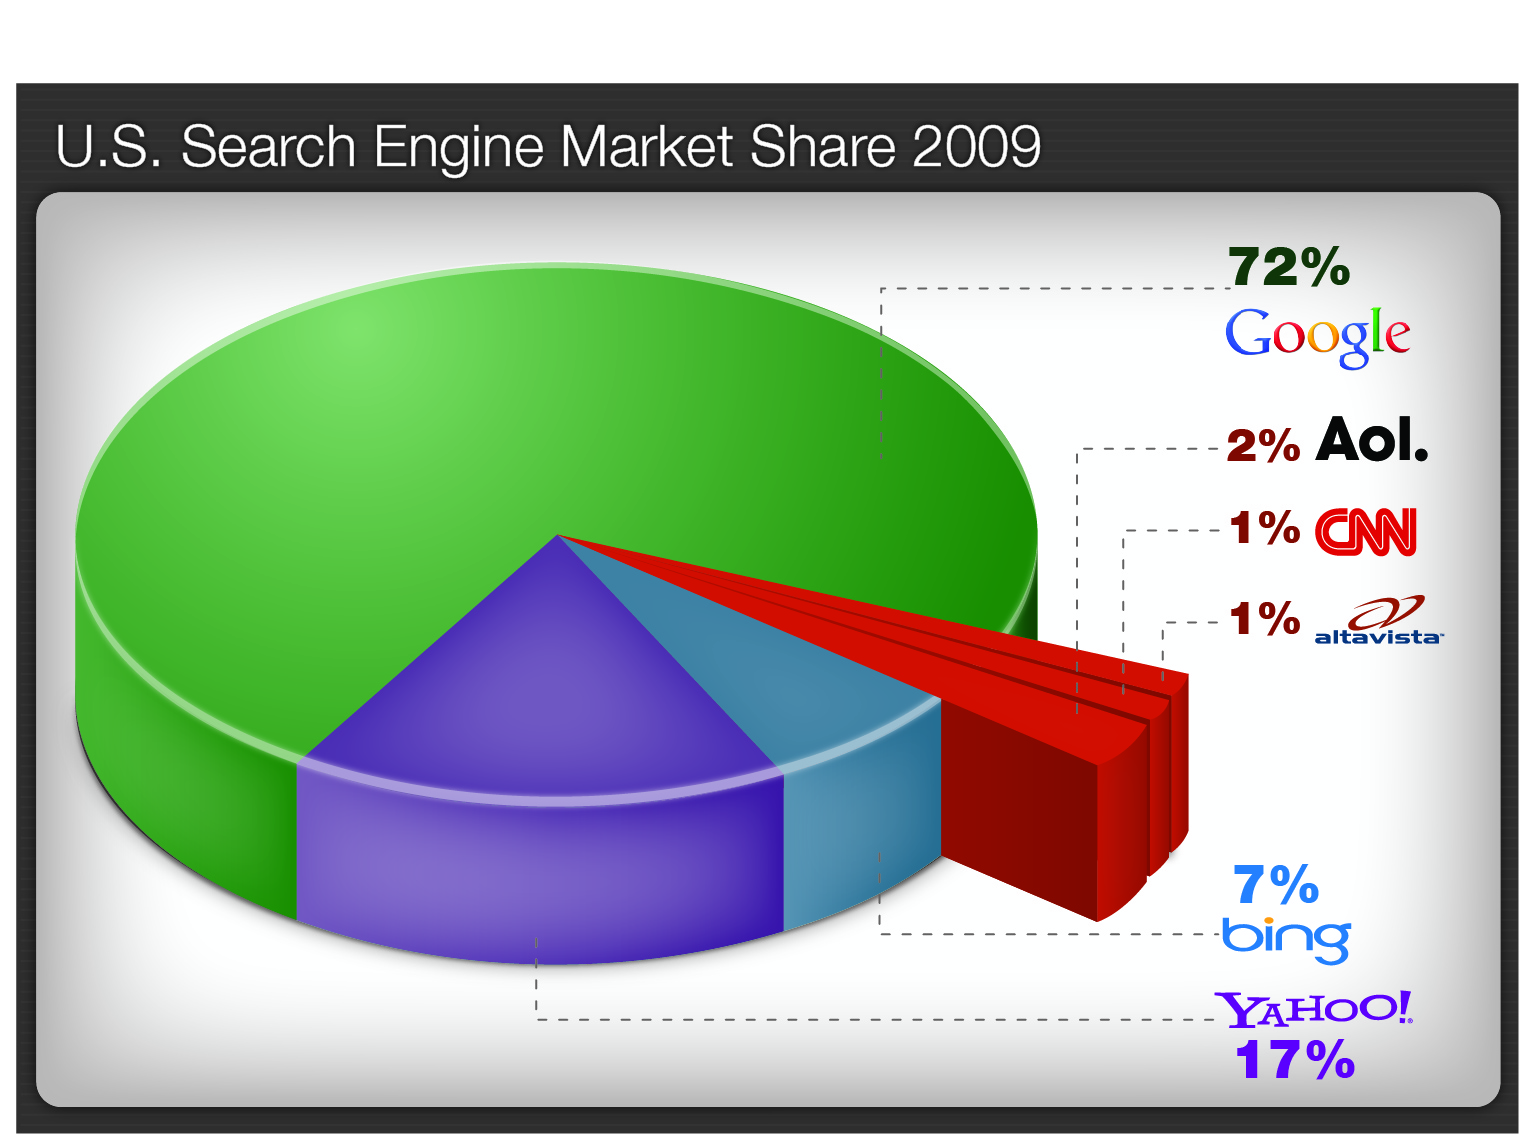
One of the simplest yet most effective ways to visually convey information is with charts. Unfortunately, a boring two-dimensional chart has become de rigueur in the courtroom and can obscure the impact of the data it contains. Providing a chart with a three-dimensional effect can serve a valuable purpose in capturing the attention of judges and jurors in a way two-dimensional charts fail to do so.
IMPACT
This example was designed to highlight Google’s competitors in the search engine market share space. By creating a three-dimensional pie chart and pulling out the 4% market share attributed to CNN, AltaVista, and AOL beyond the circle’s perimeter (without altering the actual size of that slice), we purposely emphasized the importance of that 4% percentage. This approach helped showcase the considerable impact of these smaller players in the market, allowing people to conclude that Google’s competition was not, in fact, sparse.
TECHNOLOGY USED
Illustrator and PowerPoint